JBoss AS 7 metrics
By default, the JBoss AS 7 metrics are available at 127.0.0.1 on two ports:
- 9999 via the native management API,
- 9990 via http.
Access is secured by the ManagementRealm, so you need to create a user and password, if you want to access the data via http. For more details take a look at $JBOSS_HOME/standalone/configuration/standalone.xml under the management element.
There are at least 2 ways to collect the JBoss AS 7 metrics in JBison, a web and JBoss Application Server monitoring service, highly available, with instant free email notifications and exportable data. Since JBison needs to be able to connect to your JBoss AS instance, you will need to run it by passing -b PUBLIC_IP
Expose the metrics through http with basic authentication
As already said, the interface is secured by the ManagementRealm. To create a user and password run the corresponding script in $JBOSS_HOME/bin:
./add-user.sh user passwd
By default the metrics are available at 127.0.0.1. This can be overridden by starting the server with -Djboss.bind.address.management=PUBLIC_IP where PUBLIC_IP is an IP address of your JBoss instance accessible from the internet.
You should receive a nice response in JSON format when navigating to:
These are the runtime metrics available for the ExampleDS datasource pool deployed out of the box with the standalone configuration.
For the jdbc metrics of that data source navigate to
To get statistics for the http connector open
http://PUBLIC_IP:9990/management/subsystem/web/connector/http?include-runtime=true
Collect the metrics through the Native Management API and expose them via http through a proxy, deployed as a REST application
The idea is to instrument a JBoss Application Server to expose metrics in JSON format. I’ve created a sample web application available on github which provides datasource metrics via REST. Once deployed, the application collects metrics for a particular datasource via the Native Management API.
In this case, there is no need to pass -Djboss.bind.address.management=PUBLIC_IP
The metrics are available at:
http://PUBLIC_IP:8080/buffalo/rest/datasource/ExampleDS
You can monitor a datasource deployed via a datasource descriptor. Deploy the following mysql-ds.xml file:
<datasources xmlns="http://www.jboss.org/ironjacamar/schema">
  <datasource jndi-name="java:jboss/datasources/TestDS" pool-name="MySQLPool" enabled="true" use-java-context="true">
    <connection-url>jdbc:mysql://localhost:3306/test</connection-url>
    <driver>mysql-connector-java-5.1.21.jar</driver>
    <pool>
      <max-pool-size>30</max-pool-size>
    </pool>
    <security>
      <user-name>root</user-name>
      <password></password>
    </security>
  </datasource>
</datasources>
and checkout its metrics at
http://PUBLIC_IP:8080/buffalo/rest/datasource/TestDS/mysql-ds.xml
The application can be extended for example to aggregate multiple metrics, for example “AvailableCount”, from all deployed datasources and expose them at once.
Collecting, monitoring, charting, alerting
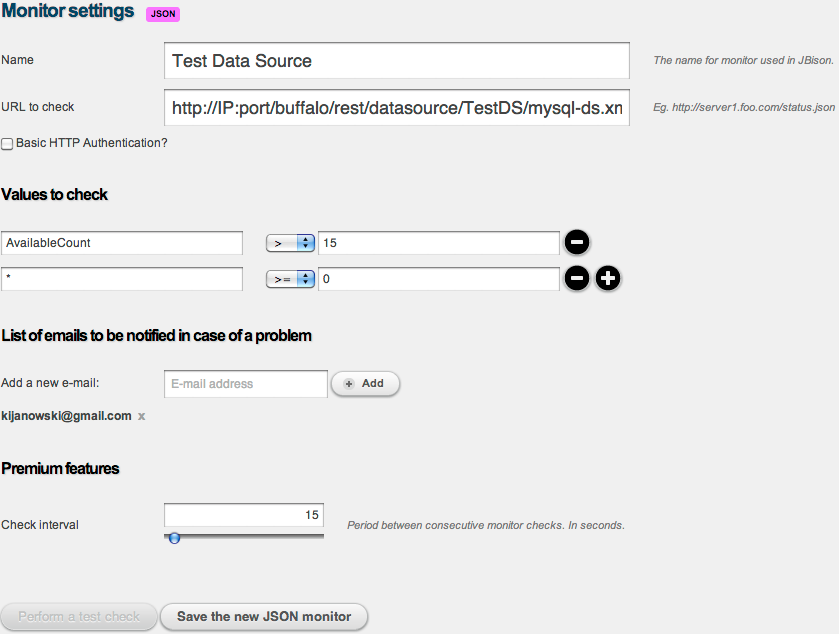
So far so good, but where is the awesomeness in all of this? It is in JBison! Login and create a JSON monitor:


Copy/paste any of the sample URLs:

For each URL you will need a separate monitor. Each monitor is able to chart any metric you wish, or all of them via the “*” wildcard. For each metric you can define an alert that will be triggered if the condition is violated. Currently only email is available, but SMS notification is under development.
In this example an alert will be sent via email, if any of the metrics is less than zero or AvailableCount is less than 15.
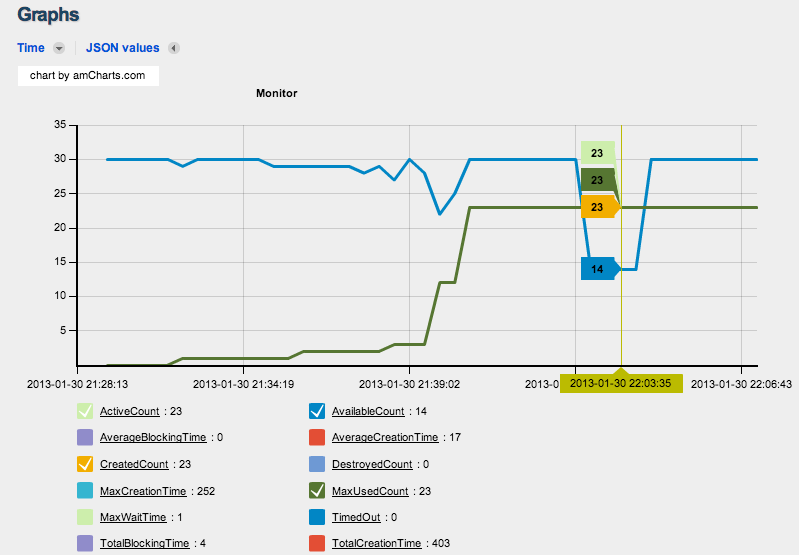
A JSON monitor consists of a table showing its current state and a chart, which allows to show and hide particular metrics and also to display their values when pointing at a particular point in time:

In case a metric is violated, that event is made visible in the UI:

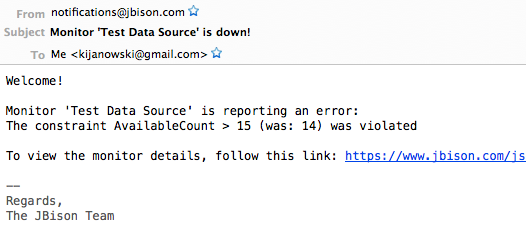
Besides this an email is sent:

Lekker!