How can you detect them and verify they send advertisement packets?
First you need a Bluettooth v4 device. I have a Bluetooth 4.0 Adapter from LogiLink. On my Mac (OS X 10.9.1) in the System Report it shows up under the USB hardware as CSR8510 A10, Vendor Cambridge Silicon Radio Ltd.
So far so good… Unfortunately under Bluetooth I still had the built-in 2.1 old-timer without LE support. The corresponding LMP version is “4”.
So how do you get the external device working? Just change the switch behaviour of the bluetooth controller to switch to the internal device as soon as it’s plugged in:
sudo nvram bluetoothHostControllerSwitchBehavior="always"
Now plug in the dongle and refresh the System Report. The LMP version is now “6” which corresponds to Bluetooth 4.
Last step to get the Gimbal beacons discovered is to install Bluetooth Explorer. Open Xcode and from the menu choose “Open Developer Tool” -> “More Developer Tools …” which will navigate you to Apple’s download site for developers. Locate “Hardware IO Tools for Xcode” and install it.
Open “Bluetooth Explorer” and from the menu choose “Devices” -> “Low Energy Devices”. Start scanning and if your Gimbal beacons are working properly, you should see tons of advertising messages showing up.
There’s a free app called Signal Sniffer which nicely displays your beacon’s activity together with a signal strength.
Two beacons were just fine but the third one was not advertising at all. So I opened up that thing and it turned out that the piece connecting the battery with the circuit board had to be bent a little bit.
]]>Check out, compile and deploy buffalo in JBoss AS 7:
git clone git://github.com/kijanowski/buffalo.git
mvn clean install
cp target/buffalo.war $JBOSS_HOME/standalone/deployments/
Start JBoss with the standalone-full profile to have the hornetq messaging subsystem enabled. Pass -c standalone-full.xml to the standalone.sh or standalone.bat script. Access http://IP:port/buffalo/rest/messaging/default/queue/testQueue to collect metrics for the testQueue.
Now it’s time to add JBison to the game. Let’s create a JSON monitor, which will fire email notifications if the number of messages in a queue reaches 100:
I started adding messages into the queue without processing them:
The queue filled up and I got an email notifying me, that one of the metrics got violated:
For further details on what resources and metrics are exposed by buffalo, take a look at buffalo’s getting started guide.
Also sign up for a free JBison account and start monitoring your JBoss resources.
]]>By default, the JBoss AS 7 metrics are available at 127.0.0.1 on two ports:
Access is secured by the ManagementRealm, so you need to create a user and password, if you want to access the data via http. For more details take a look at $JBOSS_HOME/standalone/configuration/standalone.xml under the management element.
There are at least 2 ways to collect the JBoss AS 7 metrics in JBison, a web and JBoss Application Server monitoring service, highly available, with instant free email notifications and exportable data. Since JBison needs to be able to connect to your JBoss AS instance, you will need to run it by passing -b PUBLIC_IP
As already said, the interface is secured by the ManagementRealm. To create a user and password run the corresponding script in $JBOSS_HOME/bin:
./add-user.sh user passwd
By default the metrics are available at 127.0.0.1. This can be overridden by starting the server with -Djboss.bind.address.management=PUBLIC_IP where PUBLIC_IP is an IP address of your JBoss instance accessible from the internet.
You should receive a nice response in JSON format when navigating to:
These are the runtime metrics available for the ExampleDS datasource pool deployed out of the box with the standalone configuration.
For the jdbc metrics of that data source navigate to
To get statistics for the http connector open
http://PUBLIC_IP:9990/management/subsystem/web/connector/http?include-runtime=true
The idea is to instrument a JBoss Application Server to expose metrics in JSON format. I’ve created a sample web application available on github which provides datasource metrics via REST. Once deployed, the application collects metrics for a particular datasource via the Native Management API.
In this case, there is no need to pass -Djboss.bind.address.management=PUBLIC_IP
The metrics are available at:
http://PUBLIC_IP:8080/buffalo/rest/datasource/ExampleDS
You can monitor a datasource deployed via a datasource descriptor. Deploy the following mysql-ds.xml file:
<datasources xmlns="http://www.jboss.org/ironjacamar/schema">
<datasource jndi-name="java:jboss/datasources/TestDS" pool-name="MySQLPool" enabled="true" use-java-context="true">
<connection-url>jdbc:mysql://localhost:3306/test</connection-url>
<driver>mysql-connector-java-5.1.21.jar</driver>
<pool>
<max-pool-size>30</max-pool-size>
</pool>
<security>
<user-name>root</user-name>
<password></password>
</security>
</datasource>
</datasources>
and checkout its metrics at
http://PUBLIC_IP:8080/buffalo/rest/datasource/TestDS/mysql-ds.xml
The application can be extended for example to aggregate multiple metrics, for example “AvailableCount”, from all deployed datasources and expose them at once.
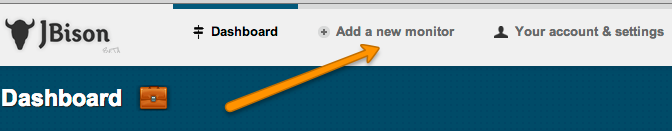
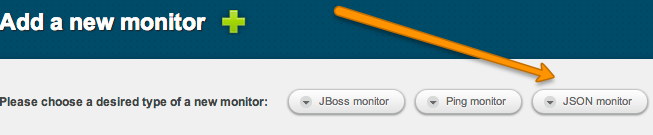
So far so good, but where is the awesomeness in all of this? It is in JBison! Login and create a JSON monitor:
Copy/paste any of the sample URLs:
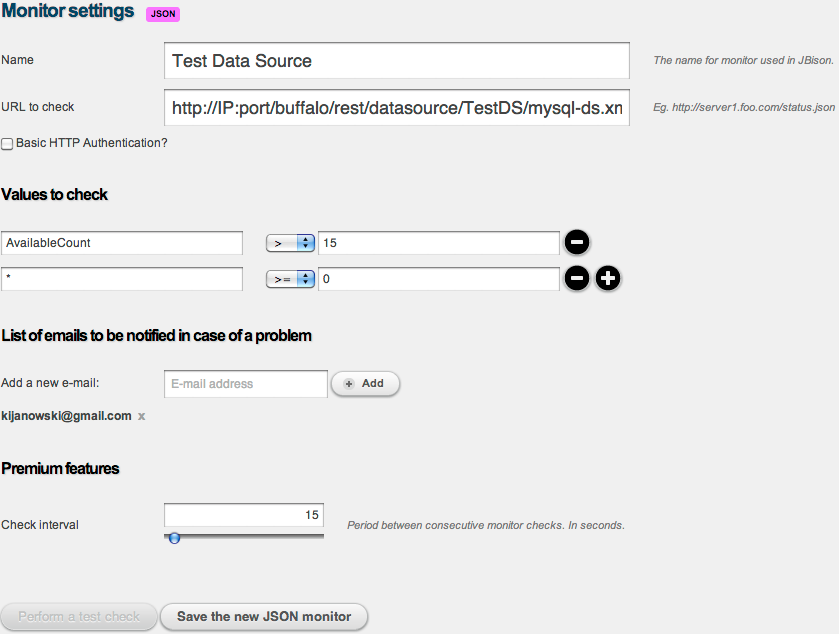
For each URL you will need a separate monitor. Each monitor is able to chart any metric you wish, or all of them via the “*” wildcard. For each metric you can define an alert that will be triggered if the condition is violated. Currently only email is available, but SMS notification is under development.
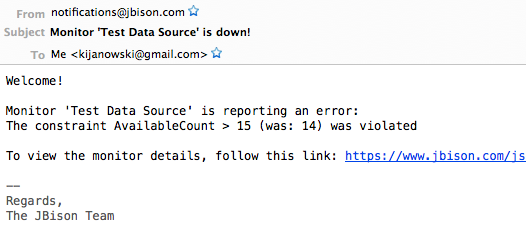
In this example an alert will be sent via email, if any of the metrics is less than zero or AvailableCount is less than 15.
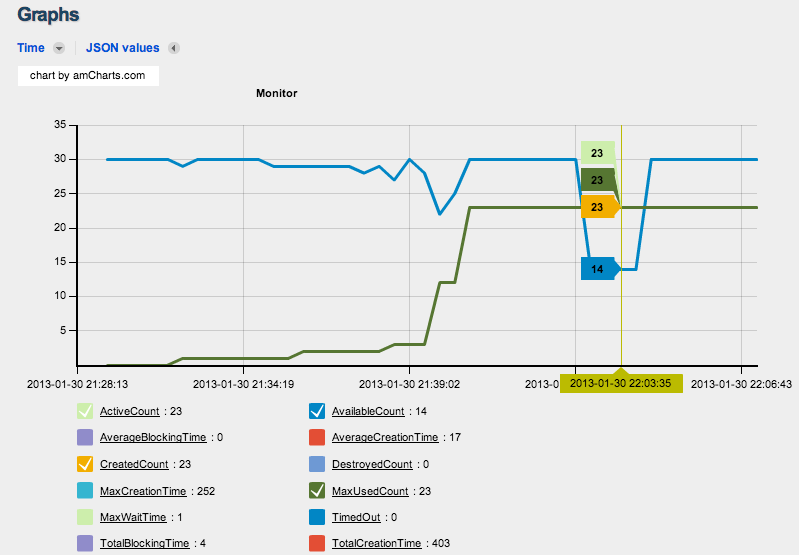
A JSON monitor consists of a table showing its current state and a chart, which allows to show and hide particular metrics and also to display their values when pointing at a particular point in time:
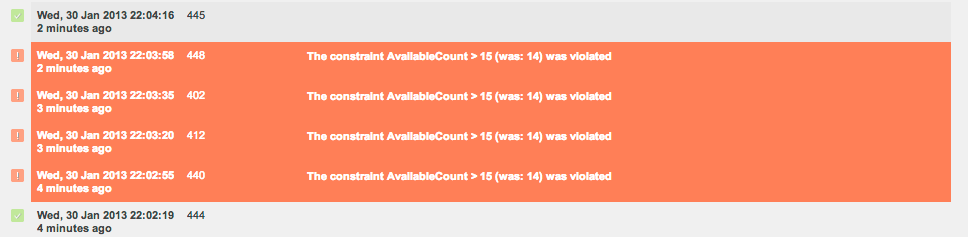
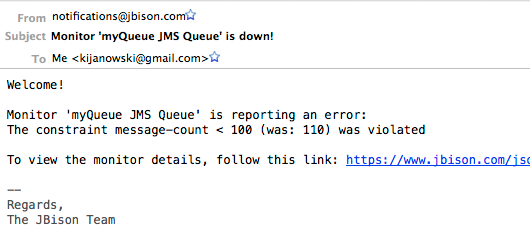
In case a metric is violated, that event is made visible in the UI:
Besides this an email is sent:
Lekker!
]]>Although it wasn’t always easy to follow I definitely recommend this book to developers who either are starting their journey with this rule engine or are already familiar with Drools. Examples are not trivial ‘hello world’ applications. Especially my favorite Drools Fusion chapter about complex event processing is built up on quite advanced rules for a fraud detection system.
One chapter is dedicated to performance, which is a must-read for all who have to deal with a huge amount of rules and facts. It explains how to write rules to take advantage of node sharing and how to speed up fact propagation using parallel mode.
Another chapter is dedicated to a complete 3-tier JEE application. It’s built up on Hibernate (for persistence), Bitronix transaction manager (for transactions), Spring MVC (for presentation) and obviously Drools (for business logic).
What’s also worth to note is the test driven development style presented in almost all examples.
To sum it up, building rule based services is not an easy task. This book introduces the Drools rule engine and deals with almost all its capabilities - starting with the core engine functionality, going through decision tables, complex event processing and business process presentation ending with advanced topics covering performance and integration points with other systems.
]]>This article explains how to use Pipelines.
]]>Most chapters are kept on a really basic level if it comes to writing Java code. On the other hand it’s sufficient to get started. Moreover all used tools are open source software, which means you can use it for free.
This book goes through almost all parts of Drools, especially the most important for business people like Guvnor, the application for authoring rules, DSLs allowing to write rules in plain English as well as support for the business analyst’s most favorite tool: Excel spreadsheets.
The author even introduces typical developers’ tools like Eclipse, however I would recommend to go through an updated guide about installing the Eclipse plugin available in the Drools docs. A new requirement, that did not make it into this book, is to set up the Drools rule engine.
There’s a chapter I like very much. It makes very clear that testing rules is an important part of the development cycle and introduces three different ways to achieve full coverage of all written rules. The inquisitive reader might also have a look at the QA Analyzer, a quite new and powerful feature available in Guvnor.
One chapter is definitely intended for Java developers - about deploying Drools applications in real world scenarios. The business people will still be able to follow, since the author keeps things easy and doesn’t go to deep into details, however I would love to read more about this topic.
The last two chapters about rule engine concepts and the newest features are a must-read for all those people who have read the Drools docs, but still need a different point of view to fully understand how Drools works. This topic is very important in my opinion, since it lets you write your rules more effectively.
What I didn’t like was the use of IE and Excel. Same results could be achieved with open source software, too. But that’s a minor one ;)
All in all, definitely a guide for non technical users, but also for developers, who have given the Drools docs a (second and third) try and still require a helping hand to sort it out how this Drools thing works and how to use it properly.
]]>FWIW, there’s also a book available released by Pack Publishing.
It covers basics, like getting the software, setting up the Eclipse IDE and making your first steps with Guvnor (a web application for authoring and managing rules) as well as more advanced concepts like support for a domain specific language, tools for rules testing and the internals of the Drools rule engine.
You can read more about this book on their website and chapter 4, Guided Rules with the Guvnor is available for free. It’s a quick introduction to start with Guvnor. It begins with building a data model in Eclipse, goes through building a business rule with the guided editor and ends with running a test scenario.
]]>This article explains how to tune Guvnor deployed on JBoss Application Server 4.2.3. It’s available in English and German.
]]>